
Run Ben, Run! Data Analysis!
Finally! I am at a point with my Nike+ app data transformation process from the raw TCX files to data I can work with. It is now time to now build the data foundation for further analysis. For this phase of the project I decided take all the run data created in my text parsing code and load it into a PostgreSQL database. I work with SQL scripts all the time, but professionally I work in a Microsoft environment, so it is nice to branch out and work with PostgreSQL.
The biggest PostgreSQL challenge I ran into was remembering to add the semicolon to the end of all my queries! Otherwise, any other difference in syntax/code editors/software between Transact SQL and PostgreSQL/PostGIS were easy to learn.
The first step was to design and build a simple database to store the data. The database is built around three tables:
- rbr_AllRuns_2016_Points – table where I upload the points and attribute data built in the TCXtoText.py script. The table will also store the geometry point objects and the geometry line segments between each point for a given run. To tie the individual runs to other tables I added a runid field, which was added to the input dataset in the TCXtoText.py script.
- rbr_AllRuns_2016_ID – table where each run’s characteristics are stored, including date, runid, descriptive info about the run, total time, average pace, fastest mile in minutes, and the fastest mile (which mile in the run).
- rbr_AllRuns_2016_MileSplits – table that stores the runid, mile marker, and time (in minutes) I completed that specific mile. The time data was calculated in the TCXtoText.py script and imported into the rbr_AllRuns_2016_Points table.
There are also several “temp” tables that are built to support the three main tables. These tables were built to clean values, generate the line geometries, add the mile markers, and mile splits. I call these “temp” tables, but I wrote them all to the database. There only “temp” in the sense that I won’t use them (probably) for analysis. Everything I need from them is in the main tables.
The code for to generate the required tables and populate the necessary data can be found on my github account – rBr_ProcessNikeGPSData.sql
If you check my code on github, my table naming isn’t very consistent for these temp tables. I will clean it up.
Early Analysis Results
I have started thinking about the analysis I want to start to build and I have played with a few ideas. Some early queries have included classifying my runs by distance and speed, finding my fastest and slowest miles, and comparing mile splits across runs and distances.
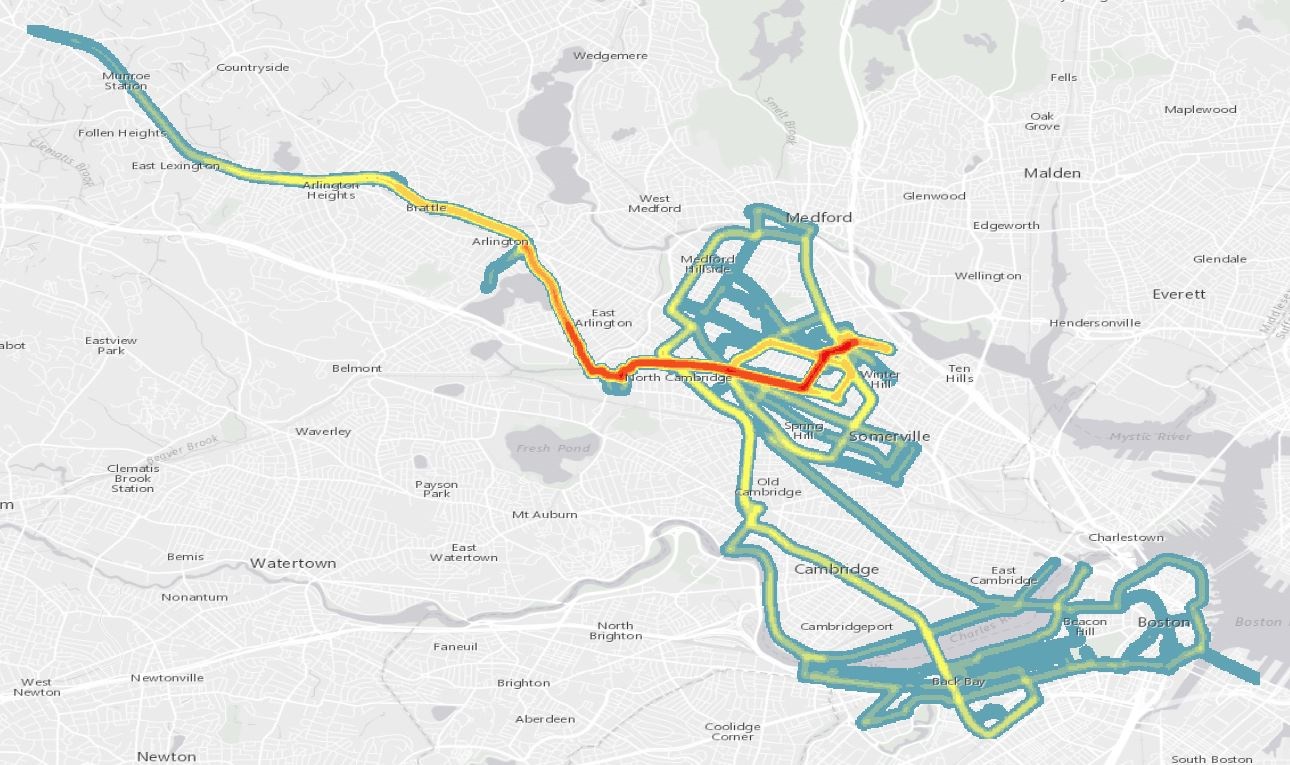
- To this point in 2016, my GPS has logged 219 runs and 442,174 GPS points, which account for 117 hours, 39 minutes and 14 seconds of running and 1126.78 miles. My marathon, for whatever reason, won’t export out of Nike+.
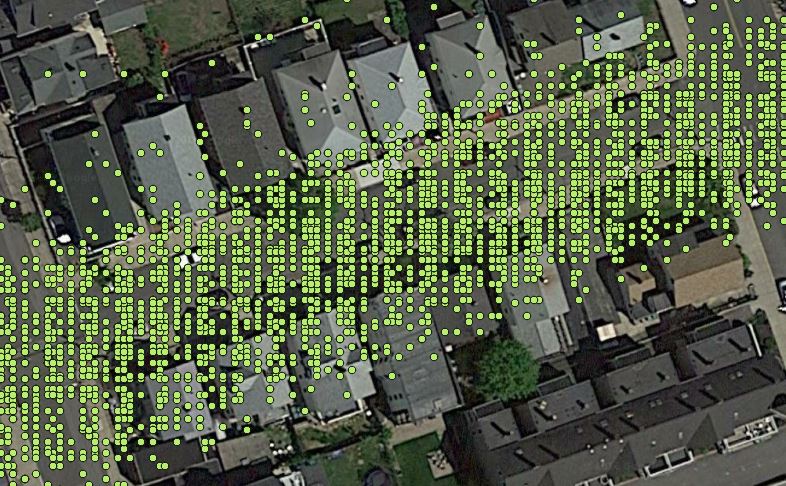
- The 442,174 GPS points sometimes create interesting patterns. For example, when zoomed into a street where I run every day, I get an interesting stripping of points. Without seeing the individual runs, it is tough to see if this is just noise or a real pattern. I know my GPS takes a reading every 0.97 seconds. Since I run the same routes so much, I believe the pattern gets amplified, creating the striping. It’s neat to see.
- Not tracked in my data – the three pairs of running shoes I have gone through this year. Adidas Supernova Sequence.
- I built a Run Type field in my ID table, where I pseudo categorize my runs by distance and speed. This categorization needs work, but so far I have more Awesome runs and Ehh runs. I’ll post the details on how I categorize these runs later.
Run Type |
Total Runs |
|---|---|
| OK | 83 |
| Intervals | 59 |
| Awesome | 34 |
| Great | 33 |
| Ehh | 10 |
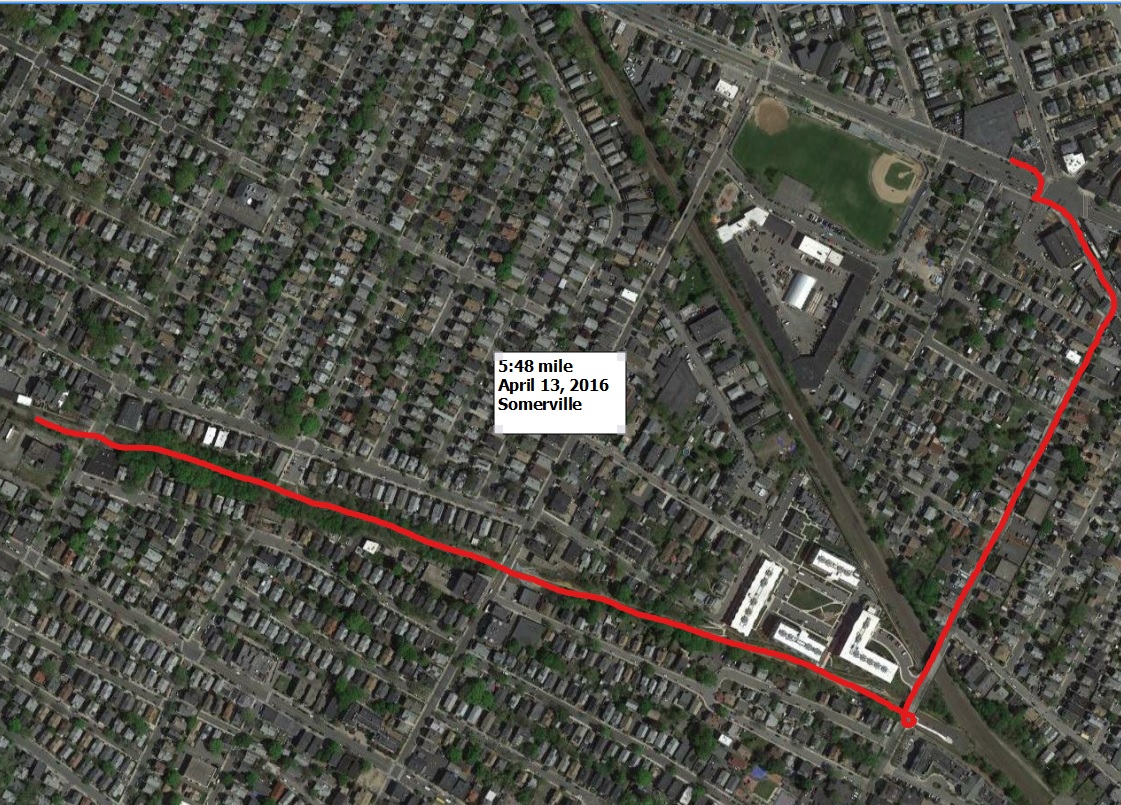
- My fastest mile that I ran that wasn’t in a race or during intervals was on April 13 at a 5:48 pace, cruising down the bike path in Somerville.
- My slowest mile was on July 31 at an 8:08 pace, but I didn’t map that!
What’s Next
Now that I have my data in a format that I can quickly query the deeper analysis will now follow. There are some data cleaning steps I need to add in during the loading process (like how to deal with pauses and breaks in the GPS data) and refining how I measure distance.
Feel free to check out the code on github and shoot me any suggestions/comments/ideas through twitter @GISDoctor.