
I’ve gone back into my running data from 2014 and 2015 to build some density maps to compare to what I have run so far in 2016. Building a 10m grid for the region, I did some simple aggregations based on the GPS points captured by my Nike+ watch and processed through my runBENrun project (see it here on github).
These aren’t heat maps. These are simple density maps. There is a difference.
<start rant>
Please stop calling every single choropleth map a heat map.
</end rant>
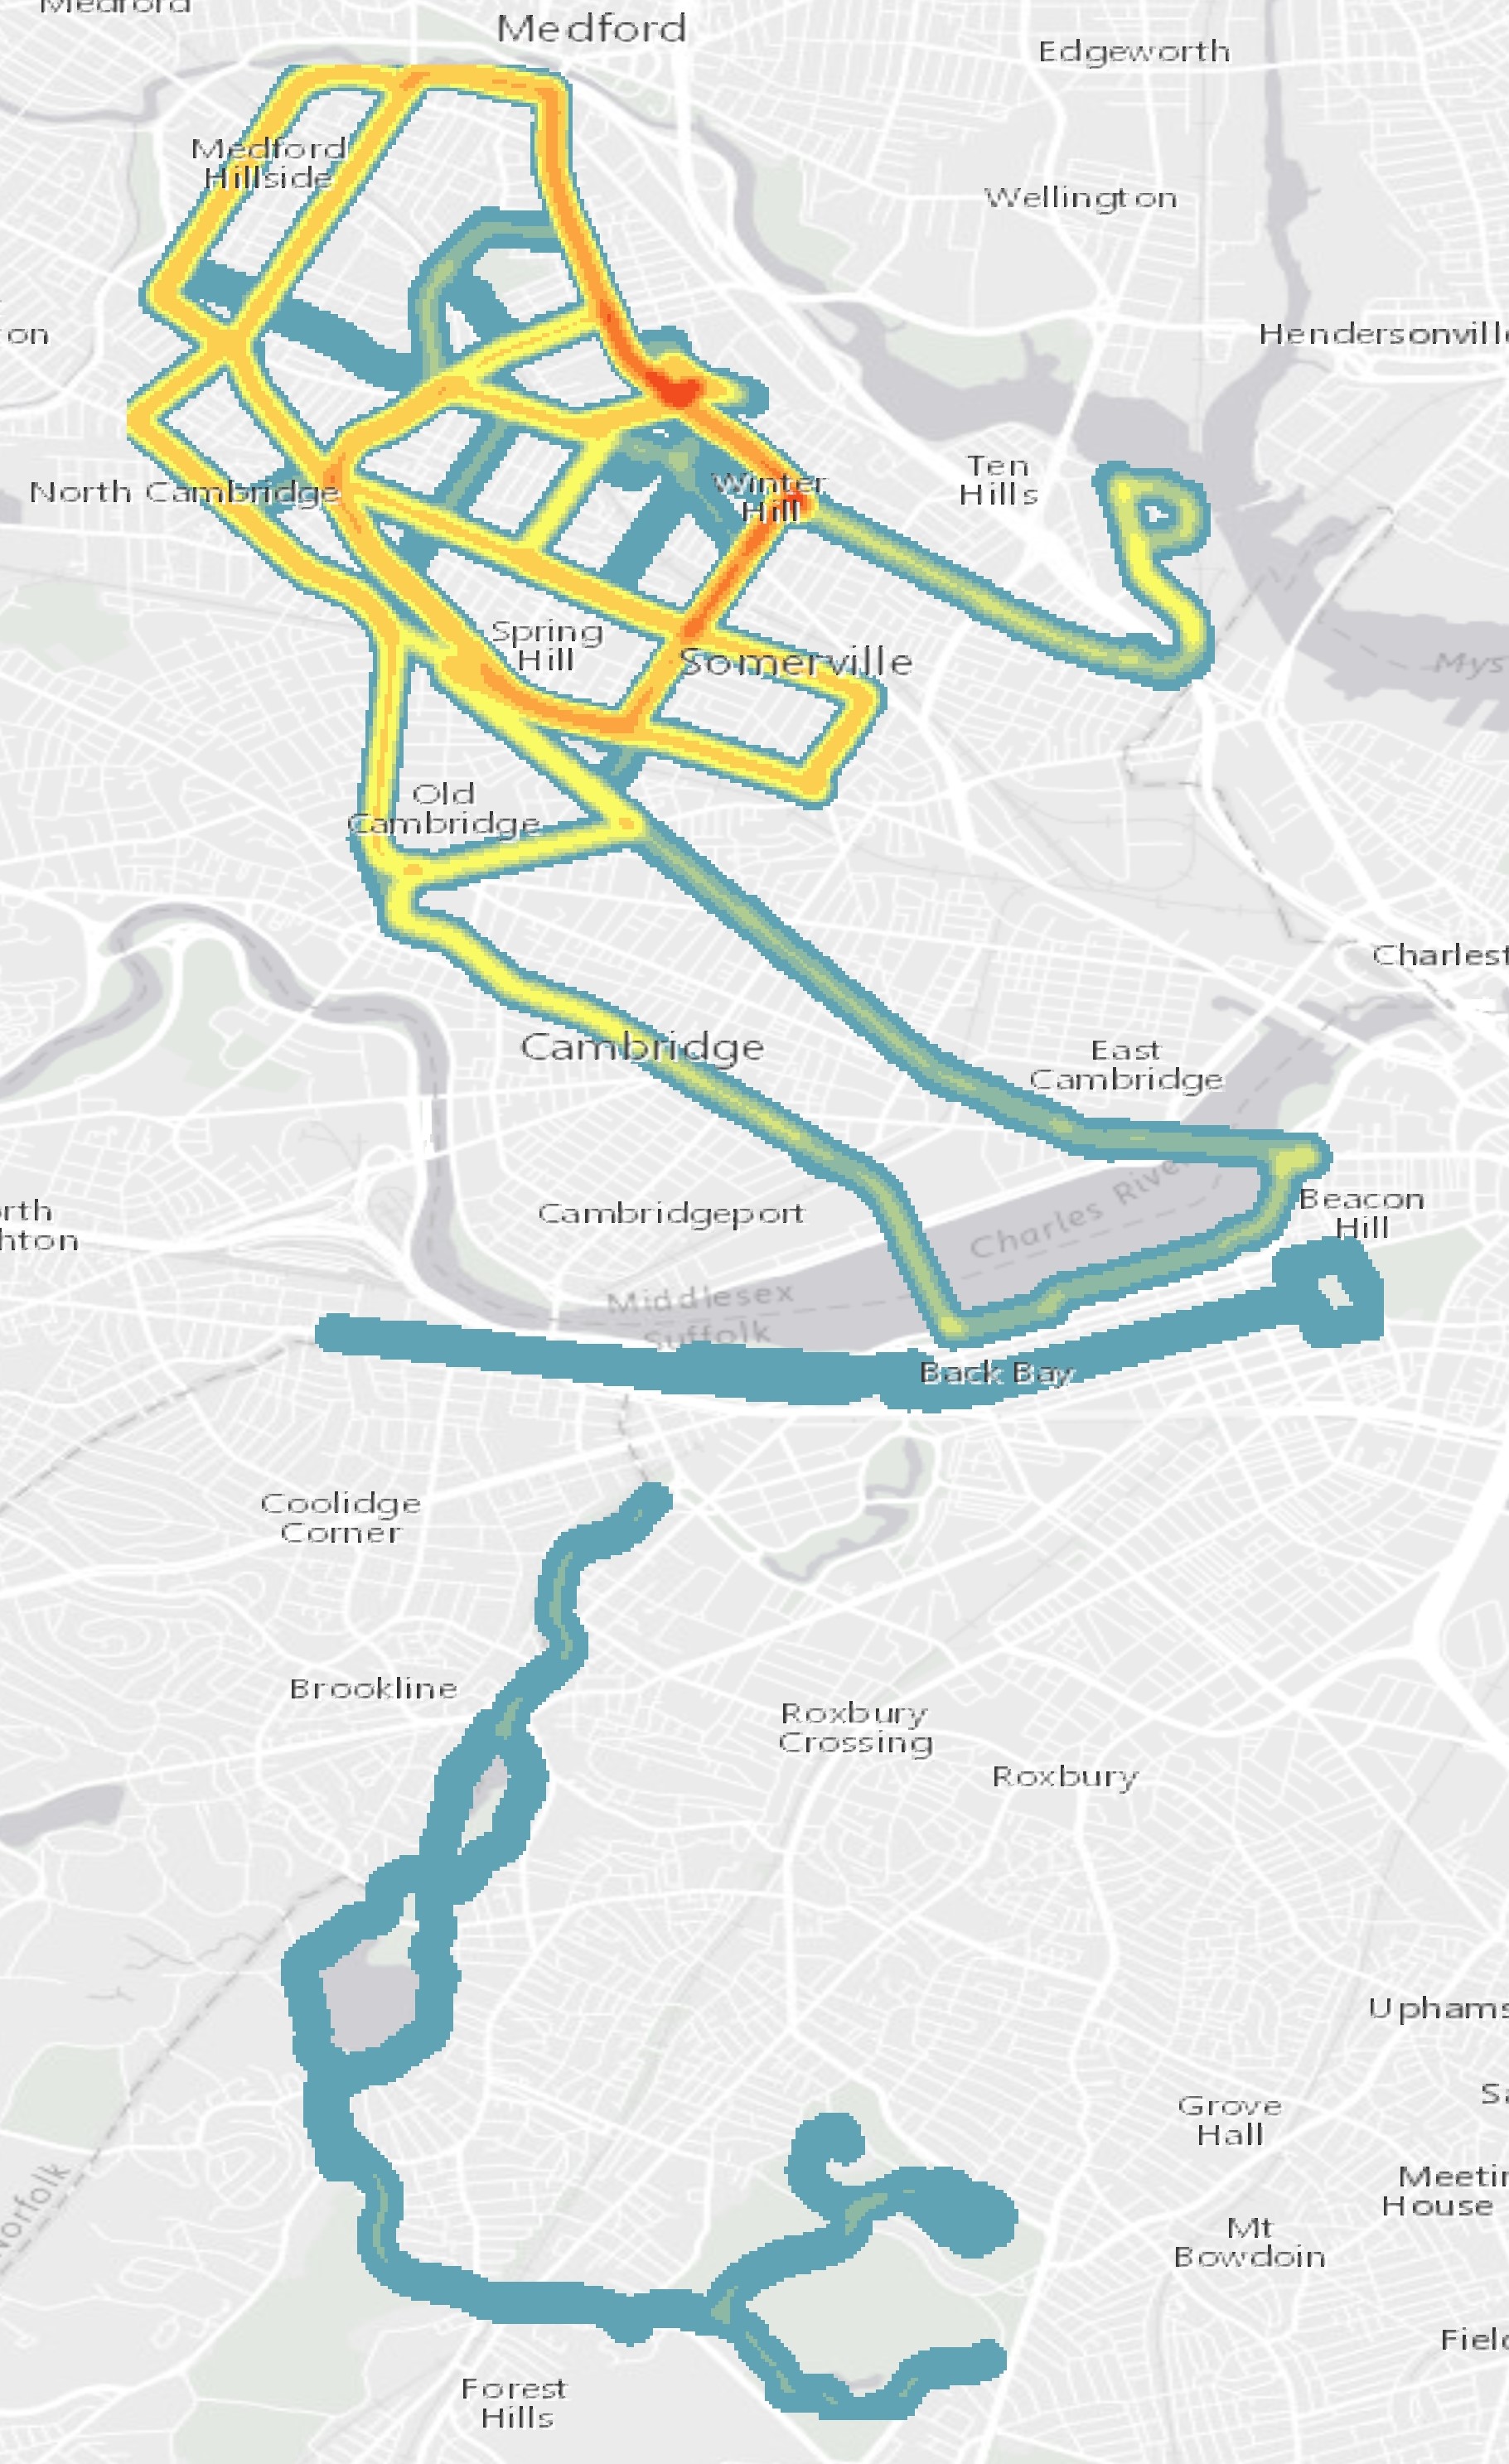
From my running data, I can see some pretty clear patterns in where I ran. In 2014, I kept my runs in Winter Hill, but ventured out into Cambridge and Boston a few times. A couple races in Boston show up, but the blue color range is only for a couple points per pixel.
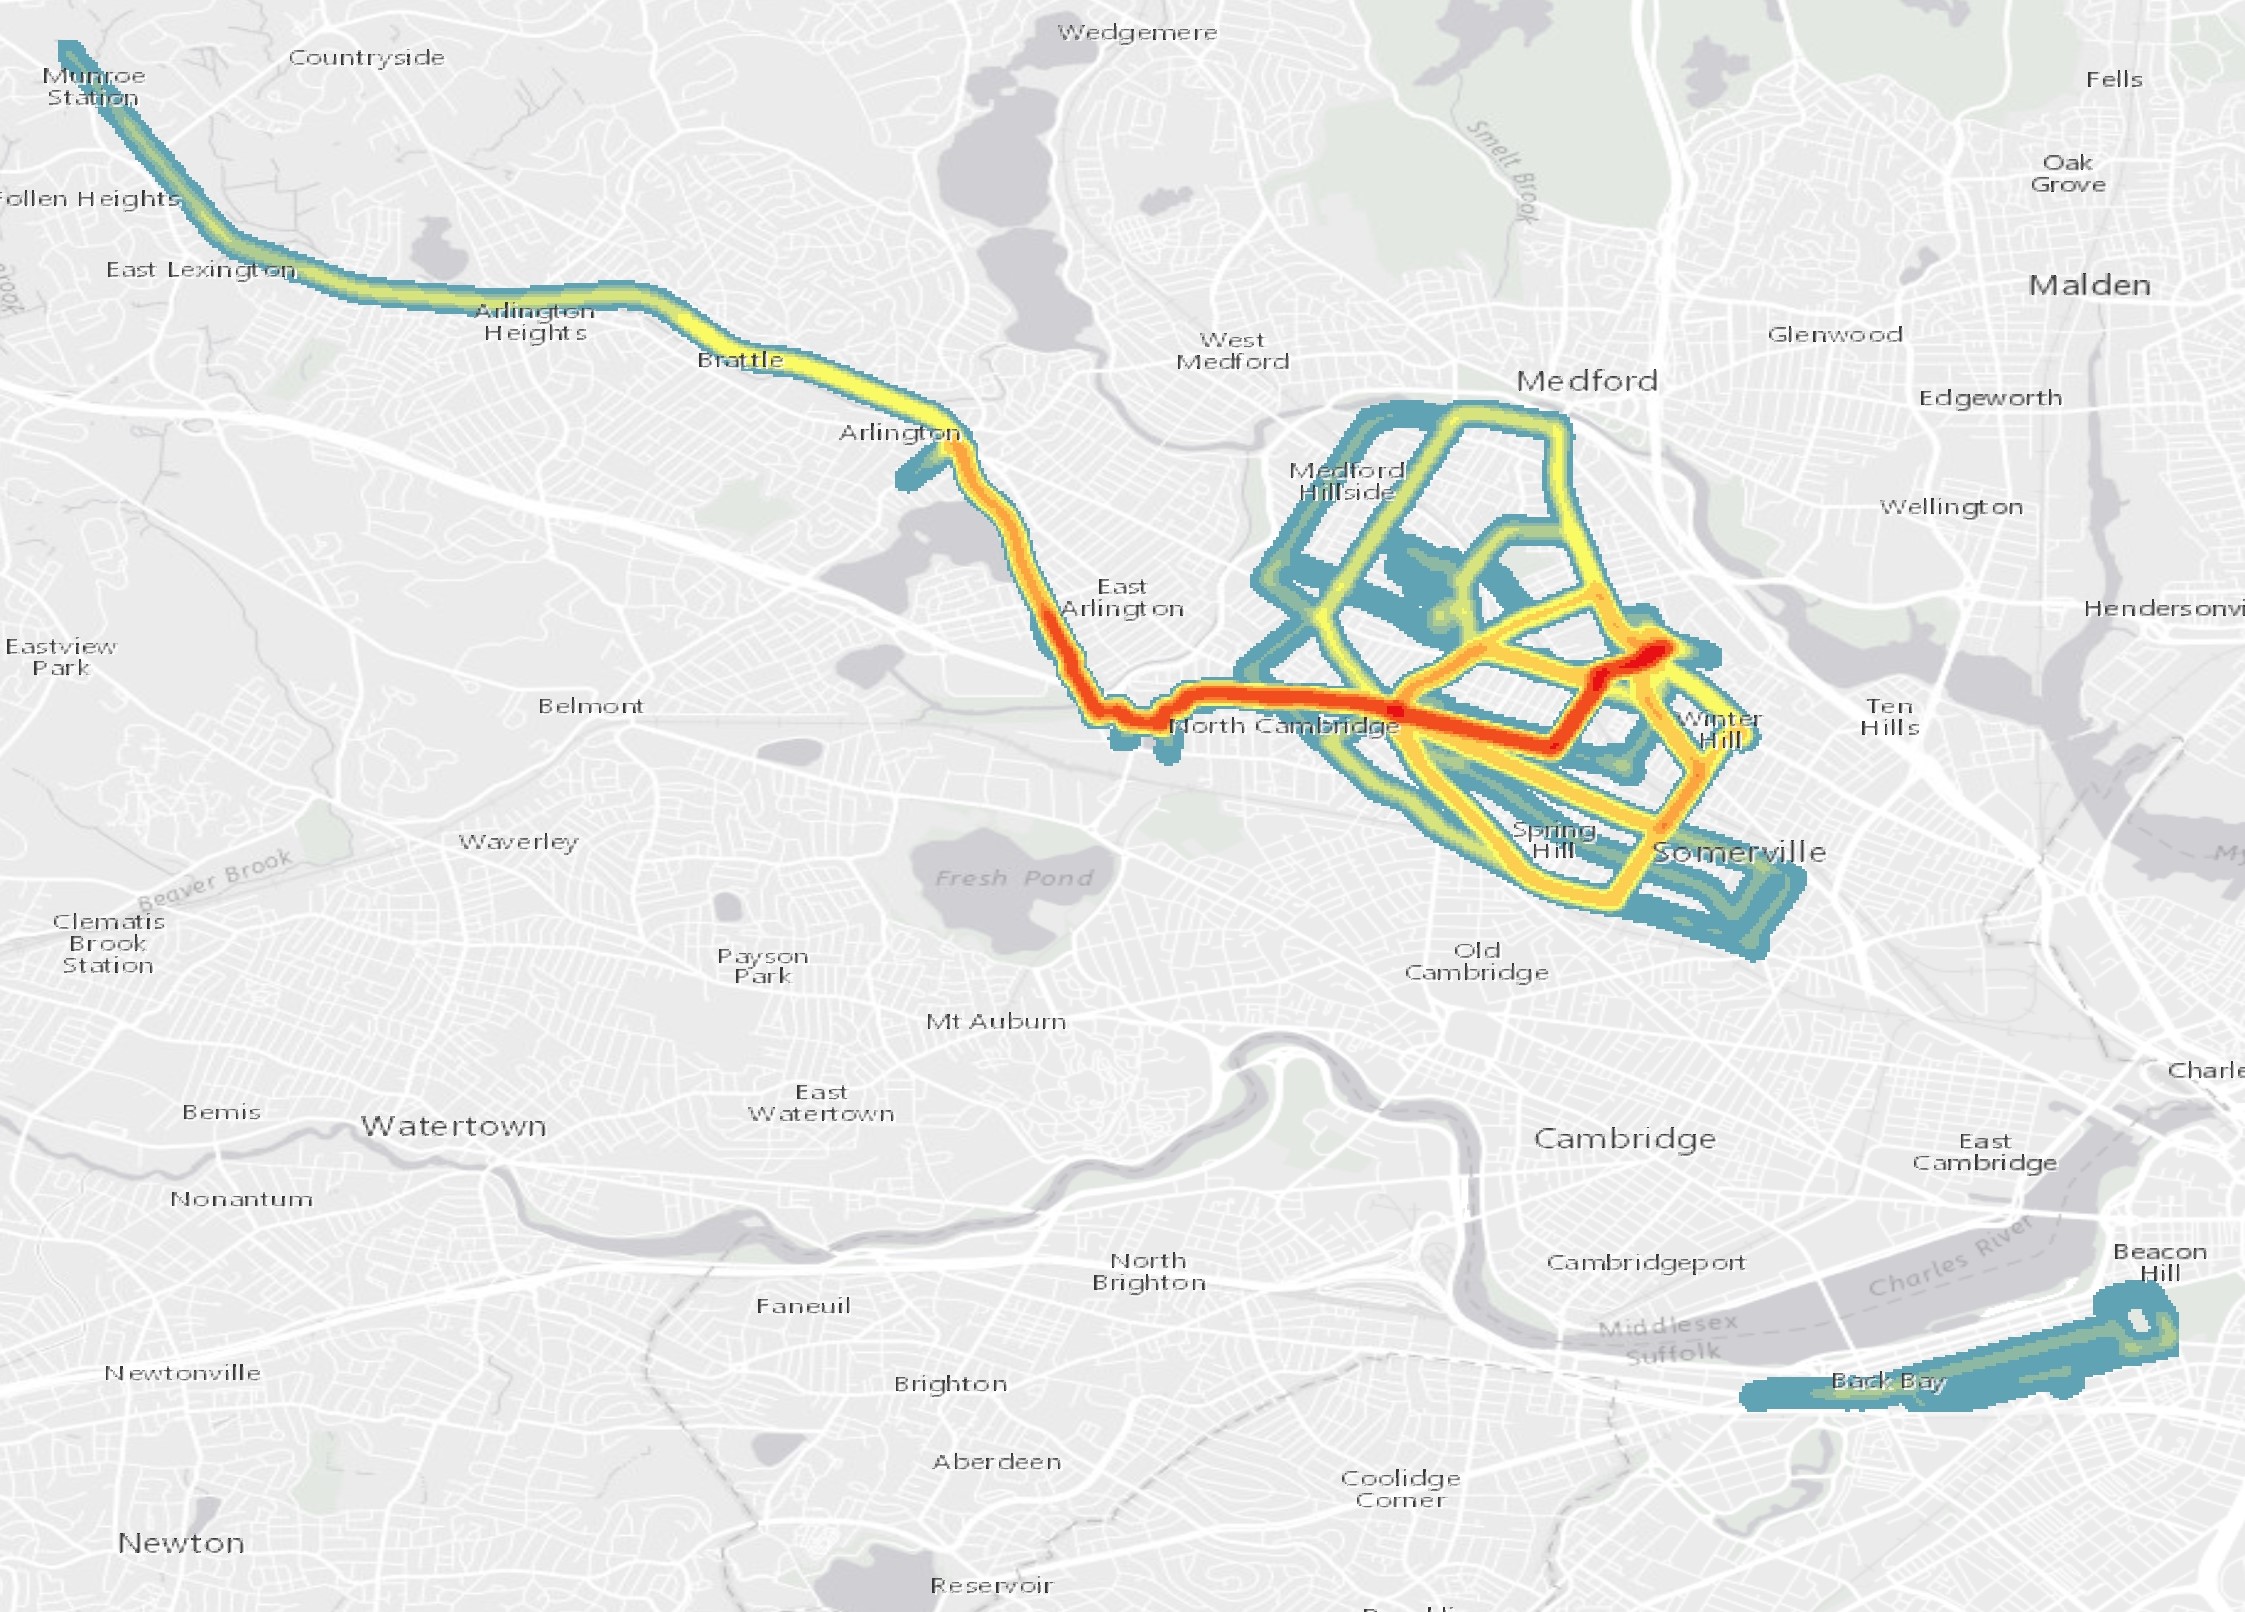
In 2015, I changed the geography of my runs. I stopped with my Winter Hill routes and went out to the Minuteman Bikeway, venturing out as far as Lexington. The darker reds indicate where most of my runs were. Again, a race in Boston stands out as a single run, as do a couple runs into Medford and the southern reaches of Somerville.
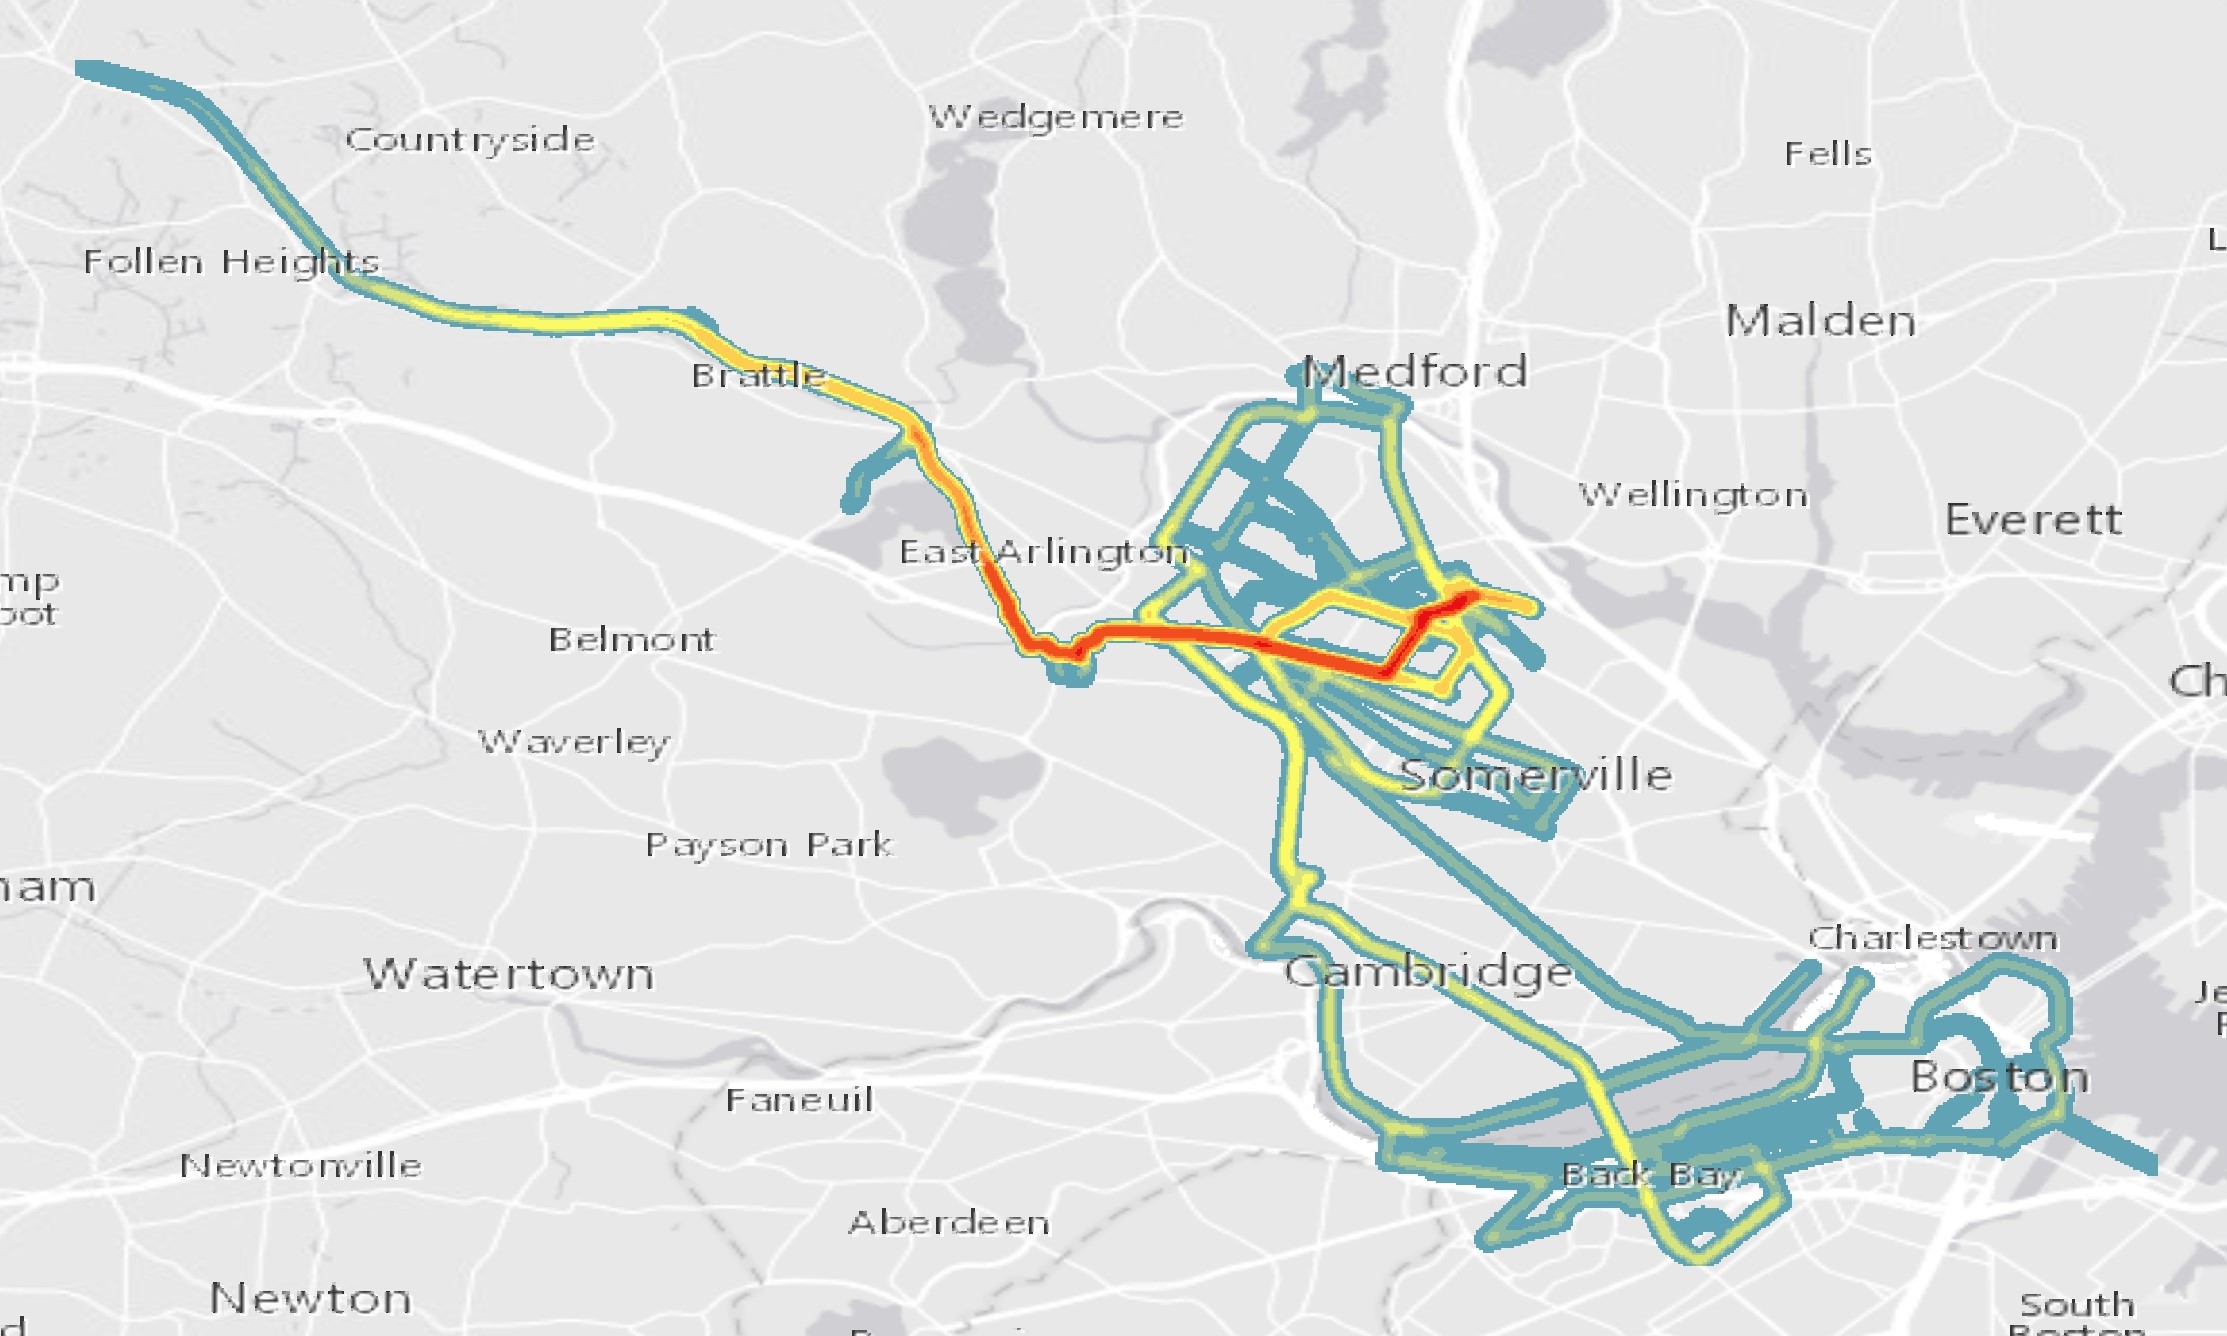
My 2016 run density map to date is much different than the previous two years. Firstly, I have put on a lot more miles this year than in past years, but almost all my miles were on the Minuteman Bikeway! I did run quite a bit into Cambrigde and Boston, mostly on my long Sunday runs as I prepared for my marathon. Like 2015, a vast majority of my runs were in Somerville and Medford, along the bike path.
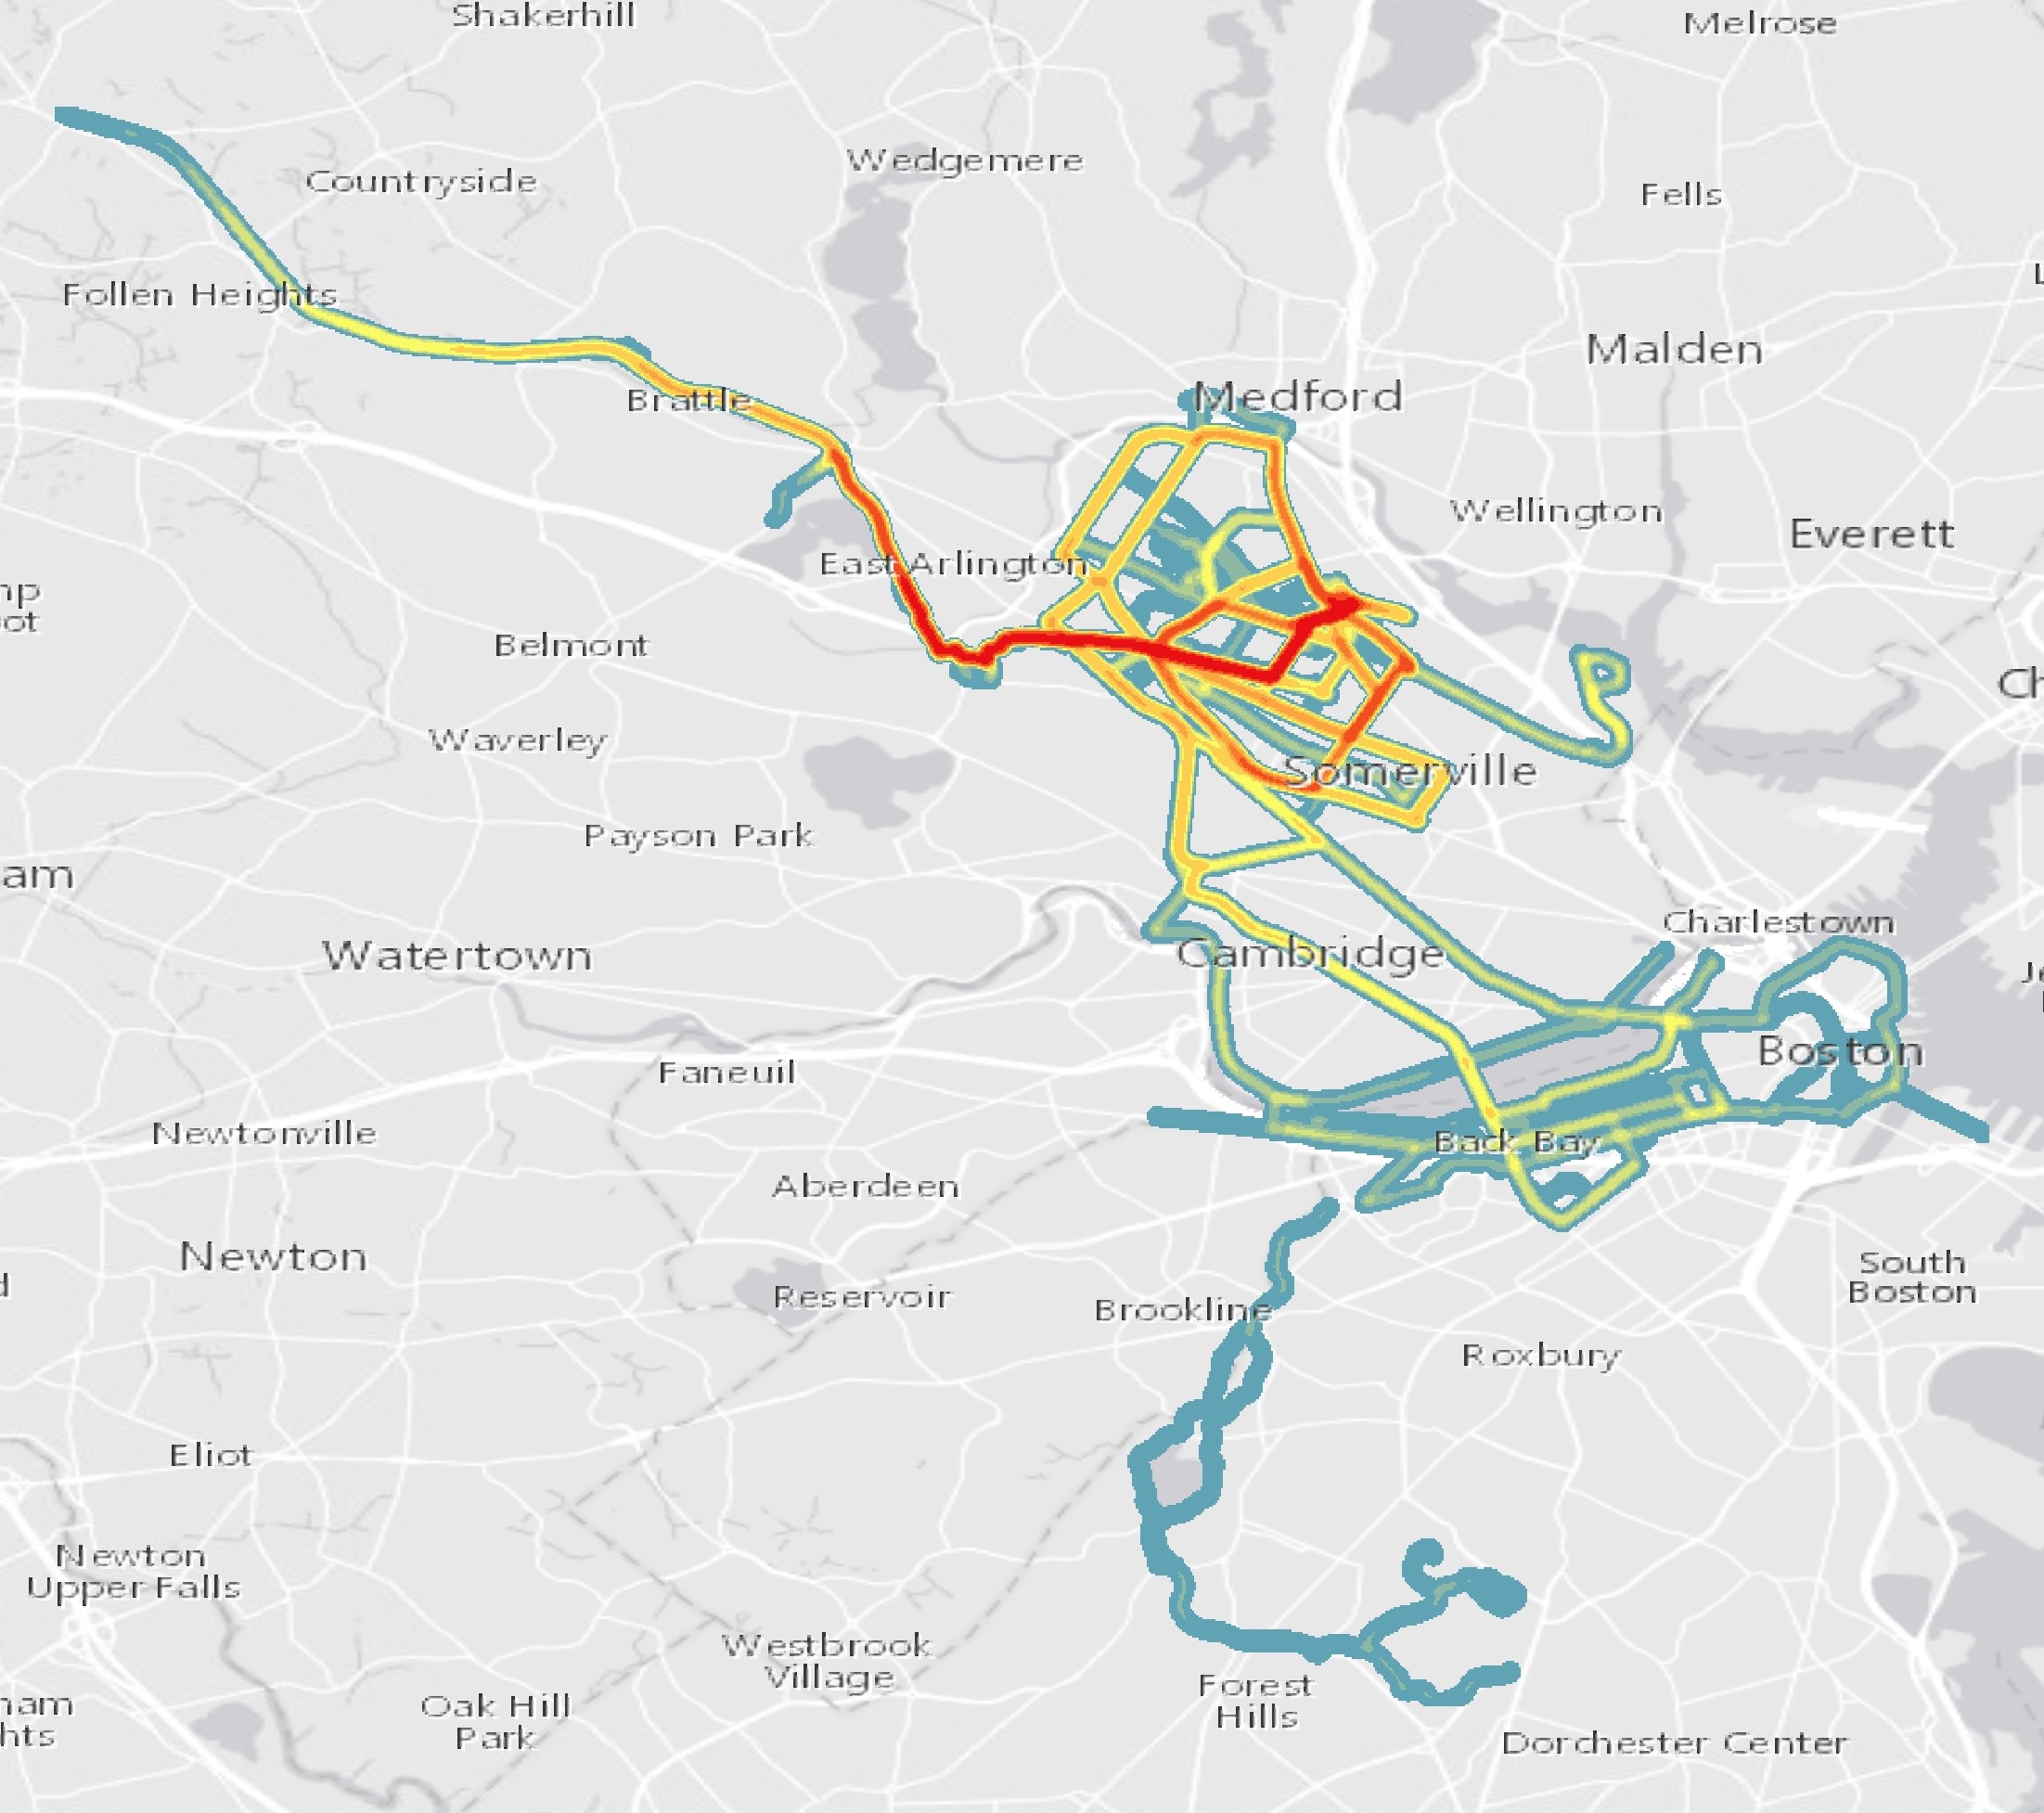
When I combine all years I get a view of my running history that I have developed quite the habit for running close to home! The runs along the Minuteman Bikeway radiate red, as I have logged hundreds of miles along the route over the past couple years. Even my adventures into Cambridge and Boston start to stand out, as I tend to use the same routes down Mass Ave, Boylston Street, and back into Somerville and Medford along Broadway in Cambridge.
This exercise didn’t reveal anything new to me, but it was a good exercise in thinking about different ways to display the data collected from my Nike+ watch through my runBENrun project.