Geospatial Topology, the Basics

The concept of topology isn’t something that every spatially enabled person fully understands.  That is OK, because I too had to learn (and relearn) how spatial topology works over the years, especially early on back in the ArcView 3.X days.  I think this experience is fairly typical of someone who uses GIS.  If one is taking a GIS course or a course that uses GIS it is not very often that the concept of spatial topology is covered in-depth or at all.  Spatial topology also may not be something that people are overly concerned about during their day-to-day workflow, meaning they may let their geospatial topology skills slide from time to time.  As a public service here is a basic overview of geospatial topology.

First question: What is topology?

You have probably heard the term topology before, whether it was in a GIS course where the instruction lightly glazed over the topic, or in a geometry/mathematics course.

Technically speaking, topology is a field of mathematics/geometry/graph theory, that studies how the properties of a shape remain under a number of different transformations, like bending, stretching, or twisting.   The field of topology is well established within mathematics and far more complicated than I wish to get in this post.

Second question: How does topology relate to GIS and spatial analysis?

Spatial analysis is at its core an analysis of shapes in space.  Geospatial topology is used to determine and preserve the relationships between shapes in the vector data model.

The GIS software we use for analysis and data storage incorporates a set of “topological rules” to define how vector objects are stored and how they can interact with each other.  These rules can dictate how nodes interact within a network, how the edges or faces of polygons coexist, or how points are organized across space.

Back in the “olden-days” (which was before “my time”) GIS users, particularly ArcInfo users, were well versed in geospatial topology because of the coverage.  The coverage data model, a precursor to today’s ubiquitous shapefile format, was unique in that topology was stored within the file.  This data format allowed users a certain set of controls to the spatial relationships within the dataset that later went away with the shapefile.  The shapefile is not a topologically valid dataset, as geometric relationships are not enforced.  For example, how may of you have downloaded (or bought) a shapefile from a data provider and it was FULL of slivers? In the Esri world geospatial topology came back with the geodatabase, and has been incorporated into a number of other geospatial data formats including spatial databases supported by Oracle, PostGIS (2.0) and SpatiaLite.

Today, topology is important in geodatabase design (for those who pay attention to it!), and data creation/editing.  By understanding the set of geospatial topology rules and creating topologically sound data, the user can have a level of trust in their data during analysis.

 Additional Resources:

Esri white paper on GIS topology 

PostGIS Topology

PostGIS 2.0 Topology Support

Oracle Topology Data Model

Vector topology in GRASS

Esri Coverage Topology

Esri Geodatabase Topology

Real topology

Vector topology cleaning with Quantum and GRASS – youtube vid
Spatial Random Sample, Sample

Often, when performing spatial analysis, one may need to execute some type of sampling across space.  For example, one may need to sample locations across a geographically continuous surface (think soils, anything weather related, etc.).  A spatial random sample can be used to select locations without bias.  With a simple python script one can develop a spatial random sample with relative ease.  In this post I will cover a few definitions, provide a code sample, and discuss some additional points.

First, a few definitions:

Random Number: A number chosen as if by chance from some specified distribution such that selection of a large set of these numbers reproduces the underlying distribution.

Statistical Randomness: A numeric sequence is said to be statistically random when it contains no recognizable patterns or regularities; sequences such as the results of an ideal dice roll, or the digits of π exhibit statistical randomness.

Simple Random Sample: A sample in which every element in the population has an equal chance of being selected.

Second, what is a spatial random sample?

Spatial Random Sample: Locations obtained by choosing x-coordinates and y-coordinates at random (p. 58). Any points that do not intersect the landform will be dropped from the list of random points.  

Third, give me some python code to do this!

import os, random
from time import strftime

f = open("C:\\Data\\output\\spatial_random_sample.csv", 'w')

#How many points will be generated
numpoints = random.randint(0,1000)

# Create the bounding box
#set longitude values - Y values
minx = -180
maxx = 180

#set latitude values - X values
miny = -23.5
maxy = 23.5

print "Start Time:", strftime("%a, %d %b %Y %H:%M:%S")
#Print the column headers
print >>f, "ID",",","X",",","Y"
for x in range(0,numpoints):
print >>f, x,",", random.uniform(minx,maxx),",",                      random.uniform(miny,maxy)
f.close()

print "Script Complete, Hooray!", numpoints, "random points generated"
print "End Time:", strftime("%a, %d %b %Y %H:%M:%S")

This quick, dirty and very simple script does a few things. First, it creates a csv file in a local directory, and by using the ‘w’ mode the file will be created if it doesn’t exist and will be overwritten every time the code is run (so be careful).

Next, the code  selects a random number of points to be generated. In this case it will be a random integer between zero and 1,000. The user will then set the bounding box for which the points will be contained by. If using ArcPy and ArcGIS the user could easily set the bounding box to that of a particular layer. In this example, it is simply 180,-180 and the approximate Tropic of Cancer and Tropic of Capricorn.

The next block of code will generate the random number of points in the specified ranges and print them to a csv file.  The output is fairly straight forward: three columns, an ID field and X and Y. The user can open the file in OpenOffice as they could any other csv file.

Well, that’s great.  With this data the user can easily visualize it in Quantum using the Add Delimited Text Layer tool from the Layer menu. Since the output was formatted with X and Y fields the tool will populate itself:

Once the user clicks OK the points will be added to the map.  From there the user can export the data to any number of formats and perform their analysis.

As you can see it is pretty easy to generate random points with the script.  In fact, ArcMap and Quantum have tools that will do this, but both run much slower than just creating a simple spatial random sample as demonstrated here, as they have many more options than this simple script.  Also, the Arc version will only work if the user has ArcEditor or the spatial analyst extension.  The folks at SpatialEcology also have a tool that will do this within ArcMap as well, and I am sure there are other tools out there as well.

But before we wrap this up, here are a couple notes:

  • This is a simple example, and not intended to be an “end-all, be-all example”.
  • Python generates psuedo-random values
  • The points that are generated have an equal chance of being created, meaning that whatever is being sampled with those coordinates has an equal chance of being selected as well.
  • The script presented here does not check against any boundaries, only a bounding box.
  • The above code can easily be extended to work within ArcPy and ArcGIS.  I can post the code later on if there is interest.

GISDoctor Spatial Analysis Post Series

There once was a well know GIS blog post that compared geographic information systems to word processors.  No matter what you think about the post we will always need people who are skilled at “writing” and have something to “write” about.

As I have said before, and will say again, if you are using GIS technologies you should have a grasp on the fundamentals.  You wouldn’t write a paper or a report without a grasp on the basics of the topic or without a knowledge of writing in general.  So, to improve the world’s GIS grammar (or at least my own), I will be posting a number of spatial analysis related topics over the course of the next few months.  Here are a few of the topics I will cover:

  • Data classification schemes
  • Understanding spatial random samples
  • Topology, from a spatial point of view
  • The basics of projections
  • Avoiding false accuracy
  • Using root mean square
  • Geary’s c and Moran’s I
  • The First Law of Geography
  • Spatial autocorrelation
  • and many more…

I’ll use a variety of software, data, and problems to explain these topics, in order to expose the reader to the broad language of GIS.

Apple and OSM – The Year of OpenStreetMap Continues

The year of OpenStreetMap continues.  You have probably heard by now that Apple is now using a mix of TIGER data and OSM tiles in their mapping application.  As I said a couple weeks ago, 2012 is the year of OpenStreetMap, and this change for Apple, who had been using Google’s mapping data, is the biggest switch to date.

As I have said before, when large, well established organizations switch to these open data sources it can have a major impact on the open data movement, and Apple is probably as big as it gets.   However, Apple could derail the momentum that is the Year of OpenStreetMap!

The rumor on the street (haha, get the pun!) is that Apple is using an older set of tiles and TIGER data (yes, that TIGER).  These older datasets aren’t perfect and anyone who has ever taken a GIS course knows that TIGER data should be used for reference purposes only, and not in a global application that will potentially have millions of users.  Now, why would Apple be using this older data?  Are we seeing a beta product while they get ready to push new tiles out soon?  Do they not have any well trained geographers or GIS pros working for them who know about data quality?  Are they not taking their mapping applications seriously?

If OpenStreetMap data is to be successfully integrated into an application the users of that application will need to trust the quality of the data.  If the most influential tech company in the world messes this up it could impact who joins the OSM movement next, and perhaps set the movement back.

For more details on the switch and the data issues check out what SlashGeo had to sayJames Fee’s comments, and this article from Geek.com.

A few motivated indivduals have created some really great mash-ups that display the new Apple tiles.  Check them out for yourself to compare what currently exists in OSM and what Apple has published:

And one last comment.  Apple’s map visualization scheme is horrible.  Of all the great basemaps out on the web and Apple designs a visualization scheme that just screams 2001.  Maybe it’s being optimized for mobile devices, but as a trained cartographer I think it looks bad.

Full disclosure.  I am not an Apple person.  I have a Dell laptop, a Samsung phone, and an old IPod.

Time to Learn Code, GIS Pros!

Check out this great article from Adena Schutzberg at Directions Magazine from earlier this week, “Should All GIS Users Learn to Code?

Adena’s answer to this question?  Yes, they should, and I totally agree.  In fact, I’ve been saying it for a while.  GIS users don’t need to be experts in multiple languages, but they should be able to both create, understand, and dissect code at some level.  I also believe that any self respecting college or university department that teaches GIS should include some programming requirement, whether it is a semester long course or integrated into an advanced GIS course.  By learning to code the GIS user becomes not only more flexibile in the workplace, but more valuable to their employer.

So, if you have a few minutes check out Adena’s article.  A lot of great points!

2012 – The Year of OpenStreetMap? Yes.

OpenStreetMap has been in the news a lot lately, and rightfully so.

Has the geospatial world reached the tipping point? Are users, developers, and society as a whole now more accepting of open-source spatial information? Are we now confident in the crowd sourced masterpiece that is OSM?

Yes, yes, and yes.

So, now two full months into 2012 I’m calling it.  2012 is the year of OpenStreetMap.  But why now?  I think it is due to a few reasons:

  • Quality and Coverage Improvements:  When OSM started many parts of the world were under-mapped, but once the community of users developed so did the maps.  Over time, and with great publicity during certain global events, the coverage and quality of the maps drastically improved.  In 2012 the data in OSM is now equal to, or better than well known web mapping tools.  For example, check out the coverage for North Korea.
  • Development of the Contributors Community: When I first learned of OSM several years ago I was skeptical of the random people creating this global street map, just like I was skeptical of Wikipedia.  Well, I was proven wrong (I’m still skeptical of Wikipedia…).  Even though there has been instances of tampering of OSM, its contributors have proven to be a consistent and reliable source of quality data.  I often spot check locations that I am familiar with to see if anything is amiss or needs to be updated, and thankfully I rarely have to make edits.  The growing and dedicated user community has really driven the quality, which is a great thing!
  • Credibility: Credibility is tough to earn, but through the efforts of users, developers, and the map using public, many reputable organizations trust the data available in OSM.  As OSM’s credibility grows a wider variety of well known organizations will start to use their data.  I’m guessing the next “big” mapping application that hits the market will be have an OSM back-end.
  • The Paywall: If you had a choice between spending something on a service or spending nothing on a very comparable (or perhaps better) service which would you select.  I would pick the equally as good free service.  You’ll see this with OSM.


So, there you have it.  I think you’ll hear a whole lot more out of OSM in 2012, whether it is about new and exciting applications built using their data, or companies switching their services from one of the major players to OSM.

There it is, my reason calling 2012, the Year of OpenStreetMap…two months late 🙂

Now, go host a mapping party!

One Million Points

I am working on a couple projects and I need to generate some random points across defined bounding boxes.  I have the basic code worked out in python and I am testing the results.  Just for kicks here is a million points generated in Python to a csv file (in 10 seconds) and drawn (rather quickly) in Quantum.  Sweet.

One Million Points

I’ll share the code on Thursday.


Maps in the News, Somerville, MA

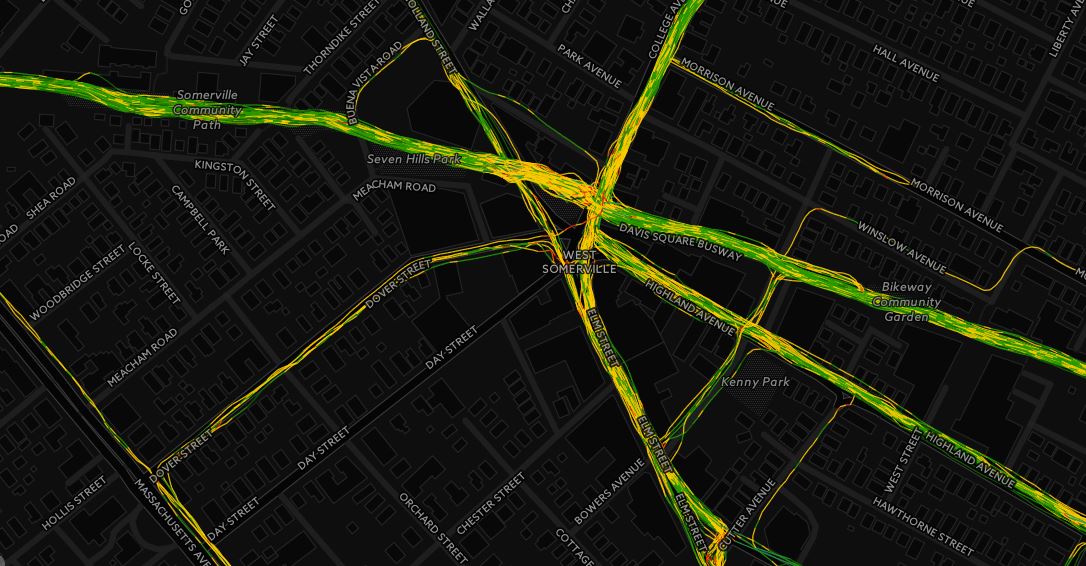
From Boston.com – Satellite imagery brings Somerville planners to new heights

I live in Somerville (and I love it), and I really hope that the city planners only use this for demonstration or decoration purposes.  This is a very technology forward city that is fairly active in collecting and analyzing data to improve functions and services within the city.

The mayor should open a mapping challenge (similar to what the MBTA has done), releasing the non-sensitive data collected by the city and along with data collected from other organizations.  They should then encourage residents and organizations to develop a series of community driven map mash-ups and applications that can be used for anything from neighborhood development, planning purposes, analyzing city ordinances, or finding access to any number of city services.

With the number of mapping and technology gurus in this city I think you would see some awesome results.   I know I have a few ideas!

Side note: This would be a great topic/workshop for an Ignite event or a Wherecamp…


Learning Code Made Easy!

I am a big supporter of GIS professionals becoming more technically proficient, keeping their skills relevant to avoid becoming a GIS dinosaurs.  One of the easiest ways for GIS pros to stay ahead of the curve is to keep learning and improving their technical skill set.

A new(ish) tool that is making the rounds throughout the interwebs this week is Codeacademy.  They provide free lessons on how to write and understand code, all through their website.  I’ve signed up and will be trying it out this weekend.

The current set of courses is for JavaScripting, a language that is very relevant to the GIS profession.  Some of my friends and coworkers have signed up and they have had positive reviews so far.

So, GIS professional,  who is looking to improve their skill set to impress their boss, here is your chance.  Signing up and getting started is easy.  Before you know it you’ll get the hang of coding and will be writing your own applications!  And the best part…it is FREE!