Spatial SQL – Multi-Point to Line Example

I have been using Spatial SQL for a while now.  I like it.  A few lines of code can do a lot of analysis or data processing.  I’ve covered a number of basic topics but there are always more to do.  Here is a script to take a series of points and convert them into a single line.   This script will use a few SQL commands, including using a cursor, developing a linestring, and STLineFromText.

The sample data comes from NOAA and the National Hurricane Center. The points represent some sample tropical cyclone forecast points for Hurricane Sandy.

The basic idea of the script is to link a set of points together using a common attribute using a cursor, combine the coordinate pairs into a line string, and use the  STLineFromText method to convert the coordinate pairs into a single line.  The script works pretty well, but since I am using a cursor it can slow down with larger (a few hundred thousand rows) datasets. A good SQL programmer probably wouldn’t use a cursor here since they can be slow and cumbersome to use.  In fact, I’m sure a good SQL programmer wouldn’t use a cursor.  I am investigating ways to not use a cursor, so if you have a suggestion let me know!

The sample script includes a sample dataset that is available here.  Take a look at the script.  If you have any suggestions to make this script faster or more efficient let me know.

/*#################################################

Script Name: multi_points_to_Line.sql
Purpose: This script will take pairs of coordinates
 of the same line and convert them into a LineString 
that can be used to generate lines of the geometry 
data type. User will need to update the database, 
tables, and column names relevant to their own analysis.

Sample Sandy data tracks represent five day
models from the National Hurricane Center.

Prepping the data - The user will need to download 
the following file and load into their SQL database:

http://www.gisdoctor.com/downloads/Line_Parts.txt

Here is a quick script to take the text file and load 
it into a table generated for this exercise:

create table Spatial_Database.dbo.Distinct_Points
([ADVISNUM] varchar(3), [lat] float, [lon] float, 
[MaxWind] int)

BULK INSERT Spatial_Database.dbo.Distinct_Points
FROM 'Path to Line_Parts.txt file'
WITH (FIELDTERMINATOR =',',FirstRow = 2);

###################################################*/
 
--Set the database to process in
use Spatial_Database
--Drop temporary table
drop table #Sandy_hur_tracks
--Create new temporary table
create table #Sandy_hur_tracks
([EventID] int, [line] geometry)

--Declare cursor variable
DECLARE @eventID varchar(10)
--Declare text string that will store coordinate pairs to
--populate the LineString
DECLARE @coordString VARCHAR(MAX)

--Initialize the cursor using the ADVISNUM column
DECLARE db_cursor CURSOR FOR
select distinct ADVISNUM
from Spatial_Database.dbo.Distinct_Points
order by ADVISNUM asc

OPEN db_cursor
FETCH NEXT FROM db_cursor INTO @eventID

WHILE @@FETCH_STATUS = 0
BEGIN

-- Clear the coordinate string with each iteration of the 
-- cursor - otherwise the coordinate string will 
-- append itself each time
set @coordString = ''
--collect all coordinate pairs and add them to a single row. 
-- Coordinate pairs are separated by a comma.
select @coordString = (COALESCE(@coordString + ', ', ' ') + 
(cast(Lon as varchar) +' ' + CAST(lat as varchar)))
FROM Spatial_Database.dbo.Distinct_Points
WHERE ADVISNUM = @EventID

--Insert the eventId and coordinate pairs into the table.         
--Coordinate pairs string is used to build the LineString to      
--create the line geometry
insert into #Sandy_hur_tracks
select @eventID as EventID,
Geometry::STLineFromText('Linestring 
(' + right(@coordString,LEN(@coordString)-1) + ')' 
, 4326) as line

FETCH NEXT FROM db_cursor INTO @eventID
END
--Close and delete the cursor
CLOSE db_cursor
DEALLOCATE db_cursor

--Select results from the temp table.
use Spatial_Database
select * from #Sandy_hur_tracks
Avid Geo September Meet-Up! [UPDATE!]

Avid Geo September Meet-Up is coming up this week. Check it out…

http://meetu.ps/jLlFg

And, again, I can’t make it. Why am I always busy on the third Thursday of the month…

UPDATE – Guido Stein, leader of the Avid Geo group, sent out an update about this month’s meet-up:

Just wanted to give you a heads up that the meeting is coming up on Thursday and we are going to be hosted by the wonderful people at Applied Geographics also know to me as my company.

This month Lars will be giving us a little demo on basic OSM editing and I will be sharing a little python code for data for geometric manipulation.

We will be trying to record and push this meeting onto youtube at the avidgeo to share the meeting with the rest of the world…

Want more info?  Check out (and join) the Avid Geo meet-up group.

How to Troubleshoot a Slow ArcMap (Story of my Life)

Esri’s Support Services blog posted a good piece today on how to troubleshoot slow performance in ArcGIS Desktop.  As someone who has spent their fair share of time troubleshooting ArcMap performance I will say that there are a few good tips in the article.  The author does make a good point at the end about understanding the realistic expectations of the software, unfortunately, most of us (including myself) tend to disregard realistic expectations and create our own on the fly 🙂

Overall, a good read and worth checking out.

I reject your reality and substitute my own…

Maps in the News, Somerville, MA

From Boston.com – Satellite imagery brings Somerville planners to new heights

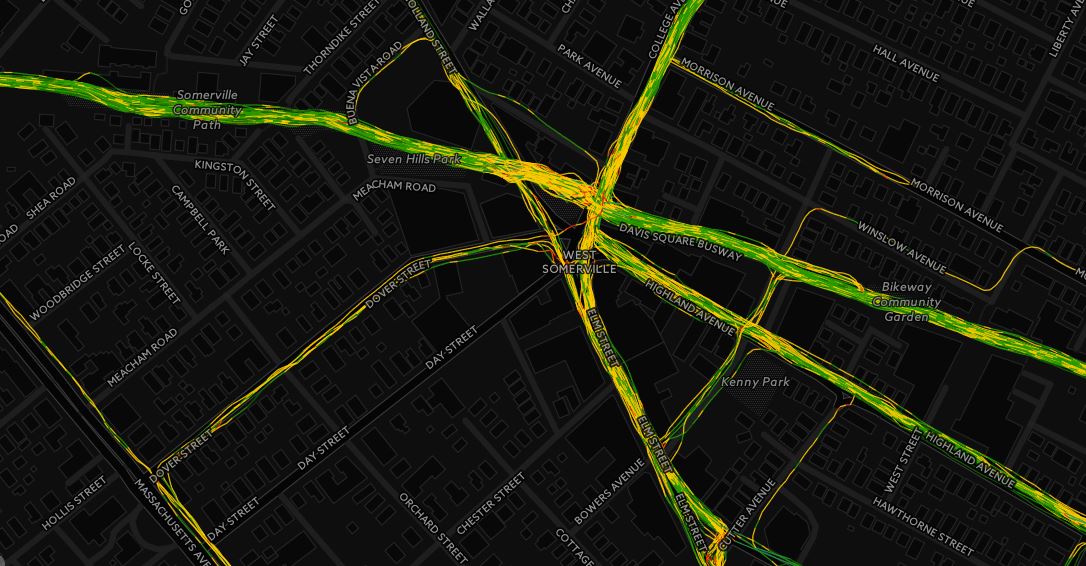
I live in Somerville (and I love it), and I really hope that the city planners only use this for demonstration or decoration purposes.  This is a very technology forward city that is fairly active in collecting and analyzing data to improve functions and services within the city.

The mayor should open a mapping challenge (similar to what the MBTA has done), releasing the non-sensitive data collected by the city and along with data collected from other organizations.  They should then encourage residents and organizations to develop a series of community driven map mash-ups and applications that can be used for anything from neighborhood development, planning purposes, analyzing city ordinances, or finding access to any number of city services.

With the number of mapping and technology gurus in this city I think you would see some awesome results.   I know I have a few ideas!

Side note: This would be a great topic/workshop for an Ignite event or a Wherecamp…


ArcGIS Viewer for Silverlight – That was easy

This past Wednesday, on the ArcGIS Server Blog, Esri informed the geo-nerd world that their ArcGIS Viewer for Silverlight v1.0 is now available for download to the world.  The viewer is essentially a wizard for creating Silverlight based ArcGIS mapping sites with a number of easy to use features.

Side note: They also released a updated version of ArcGIS for SharePoint, but since I don’t use that I’m not going to write about it.

I downloaded the ArcGIS Viewer for Silverlight and gave it a spin.  Now, I haven’t built a Silverlight app in a while as I have been focusing my attention on building Javascript applications, you know, because Silverlight is dead (jk, not really).

I had seen demonstrations of the demo version a couple times, but I had never tried it out.  Also, I had never used the ArcGIS Viewer for Flex so this was a brand new experience for me.

Here is what I thought:

  • Installation was pretty quick and I had the application up and running in a couple minutes.
  • I followed the quick start guide until I got into the application.  Once I was in the application I used the guide that was available within the tool.  I thought this was a great feature, as it can walk anyone through how to create a mapping application.
  • Following the in-program guide, I selected my basemap, easily established the “look and feel” of the site and started to add data.  I even added a logo and a couple links to the menu bar.  This literally took two minutes.  Real easy and really fast.
  • At this point I could have launched the application, but I decided to play around with the layers in the app.  For my test application I added a US counties layer, a US states layer and a few thousands points from my company’s ArcGIS Server.  I was easily able to set a number of options for the polygon data, including the altering the symbology, the attribute table options, and pop-up info.  However, when I was working with the point data the options to configure the attribute table and symbology were not available.  Now, I’m sure there is a reason for this and if I had read more the of documentation I’m sure I would have been able to figure it out.
  • One of the nice features of this application is that the page updates while you are working on it.  This is a great feature if you are not a developer or GIS expert and you just want to get a map to the web.
  • Once I was happy with my test page I simply clicked the deploy button and the application was launched on my local machine.  I sent the link to a couple coworkers and they were able to view the map and data and asked how they could create their own mapping apps.  They thought the ArcGIS Silverlight Viewer was super awesome.
Two Minutes, Pretty Easy

All this took about 12 minutes while I was waiting for a geoprocessing task to complete. I didn’t even scratch the surface of the options available in the application.  When I get a few more minutes I’ll test out other features including adding tools and geoprocessing tasks, data from ArcGIS online, and working with the layout and display options.

Traditionally I have written the code for these types of applications, which at times can be cumbersome, especially if you are managing a variety of sites.  If a user needs a quick, light weight, Silverlight mapping app and has access to well developed ArcGIS Server I would recommend this tool.

That was easy... Is this a SOPA violation?

I have to say that using tool was refreshing, especially after a couple of tough GIS software days.  You know what I am talking about.

Good work Esri!  When does the ArcGIS Viewer for JavaScript with HTML5 support come out?

Back to School!

It is that time of year again GIS geeks!  Veteran grad students are awakening from their summer hibernation while new grad students are making their way to campus wondering how they are going to survive on their huge stipend.  School is back in session!

I always loved the beginning of the college school year (I did have ten of them).  I loved seeing people again that I hadn’t seen over the summer, meeting the new crop of grad students who had yet to become jaded with the system, and most of all I loved the energy of the beginning of the school year.

Now here are my unsolicitated tips to you, the GIS grad student, that will guarantee you success in the future (disclaimer, take these tips with a grain of salt and they only apply to students who are in on-campus programs.  Sorry online degree folks…).

  1. Take advantage of technical resources.  If your department has a dedicated grad student computer lab with big, bad machines with every piece of GIS and stats software know to man loaded on them, I recommend you use it.  I was fortunate to have a pretty sweet GIS grad lab where I was able to get a ton of work done.  I also saved a ton of money on not buying a big, bad machine.
  2. If you have an office, use it.  Yes, it may be hard to get any meaningful work done in an office full of other grad students, but it is those other grad students who you want to get to know.  These are the people who you will bounce ideas off of, go out and grab lunch with, and go to conferences with.  The connections you make with your fellow grad students will be the ones you will have throughout your professional career.
  3. Expand your mind and learn something new everyday. Read the abstracts from GIS related journals, check out journal articles that are in your area of research, and read GIS blogs (like mine!).  Stay on the cutting edge!
  4. Treat grad school like an awesome job.  Show up in the morning, work all day while meeting with professors and other students, mix in a two hour lunch break, and head home at the end of the day.  I really believe this is a recipe for success in grad school.  Many GIS based grad students are in grad school to develop a set of professional skills, so they should treat the experience professionally.  I’ve seen one too many students who treated grad school like an undergraduate experience. They would roll in ten minutes before their 11am class, hang around for a little bit after class, and then head back to their apartment or dorm room and take a nap or play some XBox.  Take school seriously and you’ll find success.
  5. Do extra.  Get involved with a real world internship, do some contract work, work on a paper with your advisor or a GIS savvy professor in another department, or get a part time job doing GIS work.  Your department head or advisor may not like that you are partaking in extra-curricular activities, but a degree alone will not get you a job in today’s market.  Experience counts, so grab any chance you can to get it.  But remember, you need to make sure that you keep your grades in check and that you are making progress towards your degree.
  6. Get technical. Take advantage of the resources you have.  Learn how to program, learn about databases, learn about spatial analysis, learn about visualization, and learn about spatial data and the web.  I think you get the idea. I believe there is a strong demand for very technical geographers and GIS professionals.  Use your time in grad school to learn those skills so you can get a job.
  7. Have fun.  Even though I make it sound like grad school is all about work and results it’s not.  Enjoy the campus, the town, the people and have a good time.

Great story in the New York Times

In case you missed it there was a great story in the New York Times on Tuesday in regards to the use of GIS in historical analysis. The article, Digital Maps are Giving Scholars the Historical Lay of the Land” , by Patricia Cohen, discusses the evolution of the spatial humanities and historical GIS/geography, which are growing disciplines in the humanities at colleges and universities around the country.

The article provides a nice overview of how historians, archaeologists, and other non-geographers have embraced spatial analysis and GIS in their research.  I think this is a great article on a trend in the humanities that has been growing for years.  I remember as an undergrad ten years ago developing GIS tools to visualize historical settings.  In grad school I routinely helped non-geographers develop spatial analysis methodologies and visualization techniques to process and analyze historical GIS data.  Much of that work ended up in scholarly publications.  The spatial component really gave the authors an edge over other papers at that time.

So, if you get a few minutes check the article out.  Anytime that GIS gets mentioned in the New York Times is great for our field!

A couple of notes from the article:

  • The author references www.gis.com.  I’m sure the marketing department at Esri liked the link.
  • The article links to David Rumsey’s site.  If you are a map junkie like myself you will love this site.  An amazing map collection.  This site has really influenced the development of online map libraries around the world.
  • I wonder if the growth of GIS and spatial analysis in the humanities (which has been happening for a number of years) has increased enrollment and/or developed programs in GIS and geography at schools where the spatial humanities are strong.  The AAG should get on this.
  • Does anyone remember the digital landscape history of Manhattan that was put together a couple of years ago?  The project gained some press and buzz when it came out.  I’m surprised this article didn’t mention it.  Oh well…

Upcoming GIS Conference – Harvard Center for Geographic Analysis

I will be attending Harvard’s Center for Geographic Analysis annual conference as an interested spectator this Friday and Saturday, May 6th and 7th.  This year’s conference is focused on the future of web-mapping and geo-collaboration.  Reading through the program it looks like there will be a number of very interesting talks and demonstrations.

From the program:

“This two-day conference will bring web-mapping experts from across the country to Harvard to share their knowledge and experience, and to envision what lies ahead. Speakers will introduce ideas, systems, tools, and visions, and present case studies and discuss challenges. Some will offer live demos and hands-on training. This conference provides a forum for geospatial technologists, developers, academics and end users to engage in dialog and help shape the future of geospatial technology on the Internet.”

source

I am interested in seeing what the world of online mapping is to people who aren’t like me, a trained GIS geek.  Because, let’s face it; many new and innovative web-mapping tools don’t come from geographers, but people who have a particular problem and a new way to solve it.  I am hoping to tap into the web-mapping mojo that will be in abundance at the conference and perhaps incorporate some of the ideas into my current projects.

It looks like registration is still open for the conference. If you are in the Boston area on Friday and Saturday and want to be on the cutting edge of web-mapping and geo-collaboration this could be a great conference for you!

NASA Image of the Day and Windows 7

I recently got Windows 7 on my work machine and while I was configuring my settings I came across a new feature that I thought was pretty neat.  The user can now create a desktop background image slideshow.  All the user has to do is point the tool to a directory of images, configure some settings, and presto, desktop slideshow.

Now, what does this have to do with this blog?  Well, being a geographer who works with the natural environment, I wanted images that reflected my interests.  I proceeded to download a number of images from NASA’s Image of the Day website for this purpose.

There are a number of images that are great for the type of analysis that I do, and I often use data from NASA and other related agencies in my analysis.  There is an added bonus to these unique datasets, a number of the images come as GeoTiffs, or KMLs, making the data available in a number of GIS programs from Google Earth to Quantum (and ArcGIS).  The images have a fairly good resolution are in an open format, making them available in almost every GIS software on the market.


NASA Image of the Day in Google Earth

Other examples of these NASA images that are in GIS friendly format include smog over northern China, recent flooding in Australia, and volcanic activity on Mt. Etna. However, not all the images are rectified, so make sure you check the details before you download.

NASA Image of the Day in Quantum

Now are the images exactly what you need to solve a problem at work or in class?  Maybe not, but they are a great demonstration in regards to the power of remote sensing and GIScience.  I’ve used images from this site a number of times during lectures, and when appropriate, in projects for work (don’t worry, I know the terms and conditions).  So, if you have five minutes (which may turn into an hour), browse the site, download a few images for your sweet new desktop background image slideshow, and take note of what could help you in your day-to-day GIS workflow.